Case Study:
Analytics Module for ERP System
Empowering Data-Driven Decisions Across Business Operations.
Overview:
The Analytics Module was designed to help Cinqd users gain valuable insights across various business functions. Our aim was to create a centralized reporting system that visualizes key metrics in real-time, supports performance tracking, and simplifies decision-making through actionable data.
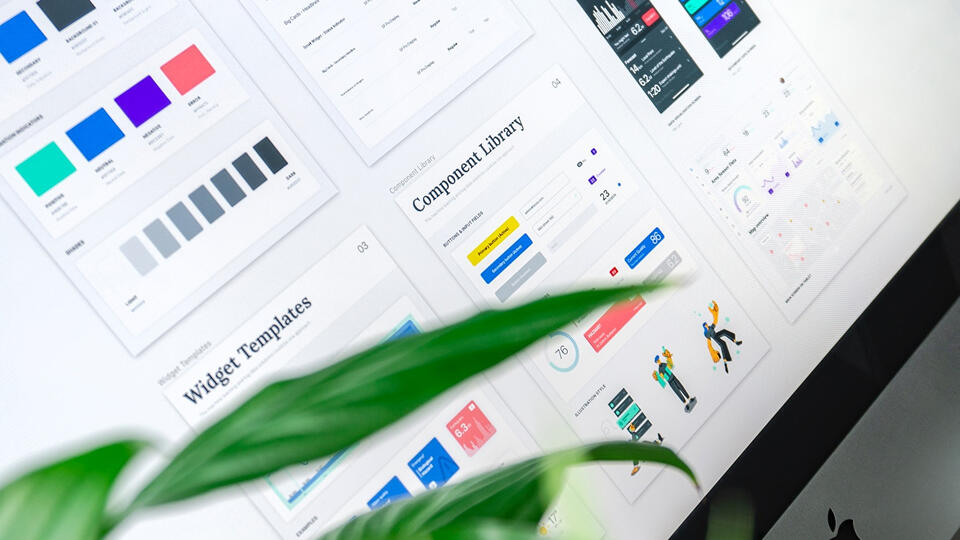
Final Design:
Problem Statement:
Prior to the Analytics Module, users faced multiple data-related challenges:• Scattered reports across different modules, leading to data silos.• Manual data compilation, which was time-consuming and error-prone.• Lack of visibility into team performance and business health.• Inability to customize reports, export data, or schedule insights for specific timeframes.
Key Objectives:
The key objectives of the Analytics module were:• Centralize Reporting.• Visualize Data Effectively.• Enable Report Automation.• Empower Customization.• Drive Actionable Insights.
Research & User Insights:
We conducted interviews with managers, operations staff, and executives across departments.
Key insights included:• Managers needed weekly auto-generated reports with performance metrics.• Operations teams wanted real-time access to active data without switching modules.• Executives preferred visual summaries to monitor KPIs and business performance at a glance.
Collaboration:
Creating the Analytics Module required input from various roles:• Product owners and executives helped define KPIsand reporting standards.• Department heads outlined the most important metrics for daily operations.• Developers ensured data accuracy and built real-time integration across modules.• UI/UX designers (my role)focused on clarity, interactivity, and responsive design.We collaborated through frequent review cycles, user testing, and design iteration workshops.
Design Process:
a. Wireframing & Prototyping:• Created low-fidelity wireframes for the analytics dashboard and individual reports.• Built high-fidelity interactive prototypes for usability testing and early feedback.
b. UI/UX Design:• Designed modular, customized dashboards for different analytics.• Implemented filtering, column management, and layout presets for report customization.• Designed intuitive CSV export, auto-report setup, and column reordering tools.• Help sections for quick access to help center.
c. User Testing & Feedback:• Conducted multiple testing rounds with real users from sales, HR, and management.• Improved visual hierarchy, data readability, and user flow based on feedback.

Impact & Results:
• Improved visibility into performance across modules with centralized reporting..• Saved hours weekly through automated report generation and exports.• Better strategic decisions with access to real-time, actionable metrics.• Enhanced productivity by giving teams the tools to track their own progress and spot inefficiencies.


